The Bus Observatory
Published on
BusWatching is a micro-publication highlighting the thinking and work of a bus data working group we’ve been building at Cornell Tech throughout 2020–2021, continuing into 2022.
- The first article, “Can Better Data Unlock A Bright Future for Buses?”, provides background on the project — its inspiration, its aims, and its importance.
- The second article, “The Bigness of Bus Data”, digs into the techniques we developed to retrieve, store, and distribute data on the operations of New York City buses.
- Article three, “From Sensing to Sensemaking: Models, Analytics, and Visualizations”, explores student work in modeling, analytics, and visualization built on top of this data. These demonstrate the potential of what easy access to longitudinal data about buses can unlock — these include:
- a diff-style data analysis tool for comparing performance of bus service by route and period
- a predictive model for understanding the impact of service disruptions on nearby subway lines on bus crowding;
- a predictive model exploring interactions between severe heat and rainfall, inadequate shelters at bus stops, and ridership
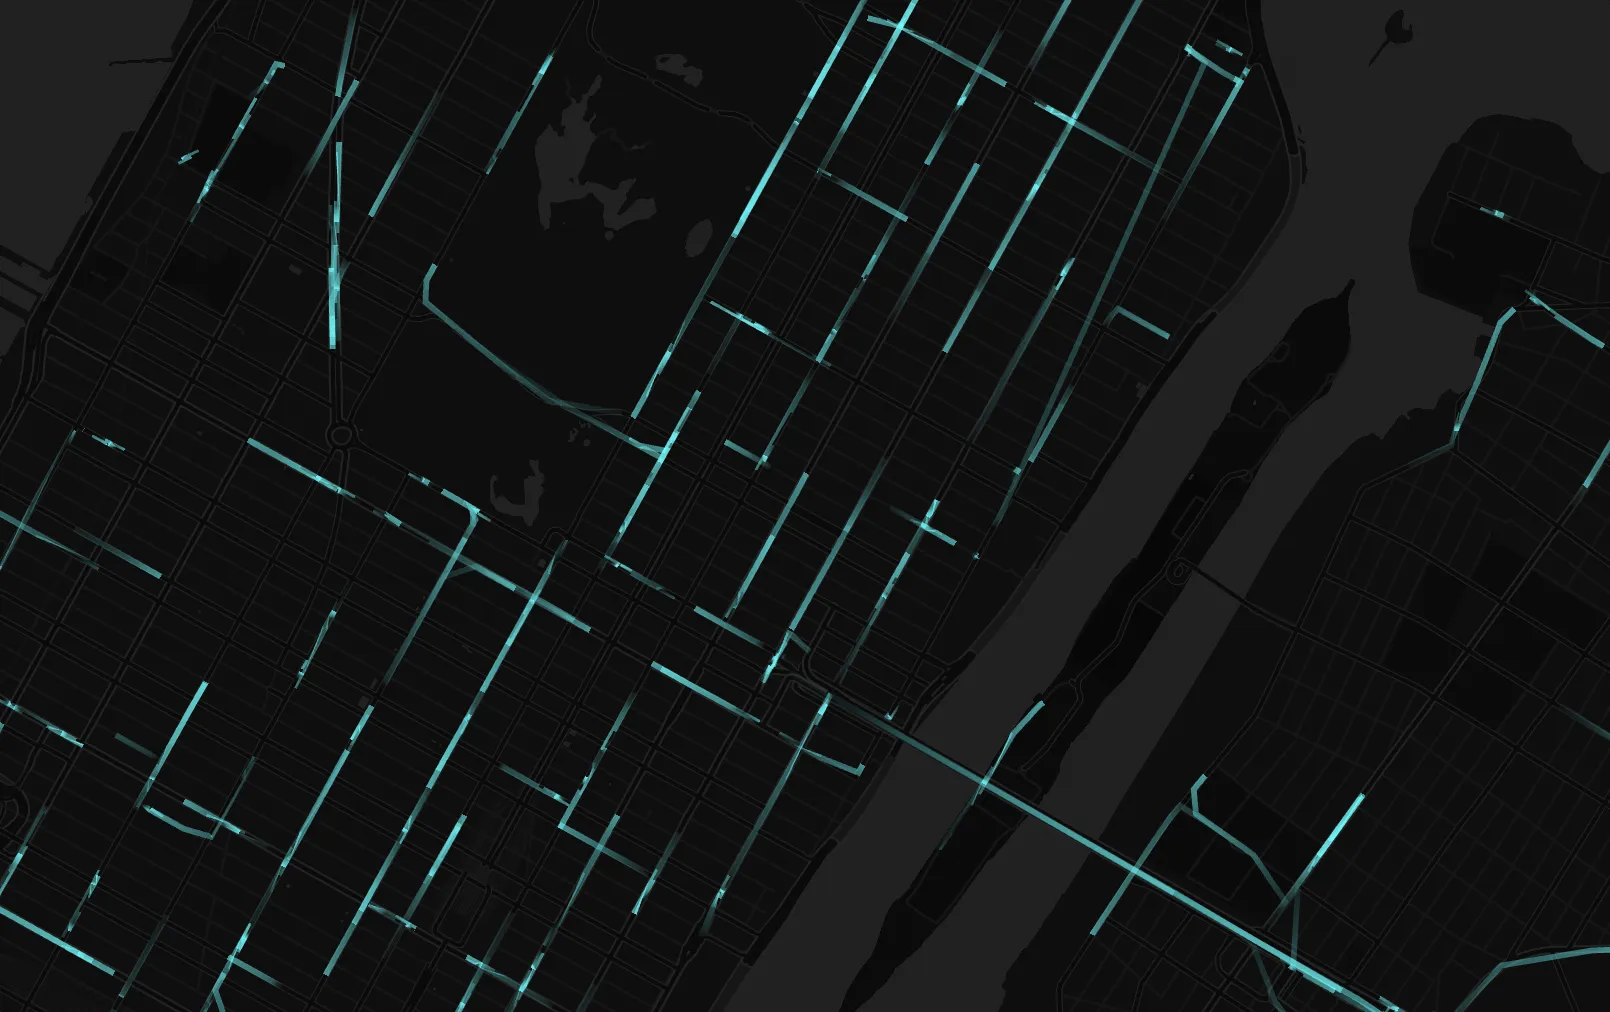
- an interactive map-based data visualization of the entire New York City bus system - Finally, article four, “Towards A Global Bus Observatory” lays out our vision and plan for 2022, and the opportunities and technical challenges we anticipate in the year ahead.
About the Author

Urban Technologist